To get started, log in to your portal as either an Account Owner or a Facilitator and navigate to the Dashboards tab at the top. Depending on your organization's settings, you may not see all of these options available to you. The left bar will allow you to see the report sections that you have access to. Below - you'll see details on each of these sections:
Utilization
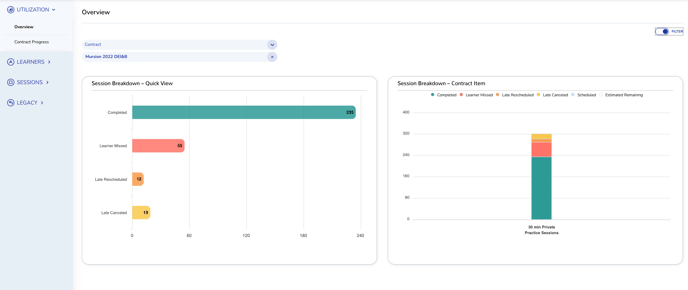
Overview
This report allows you to see the number of sessions you have utilized against your contract, including a session breakdown based on the status of the particular sessions. If your organization has multiple active contracts, you can select the contract you wish to see from the dropdown at the top of the page.
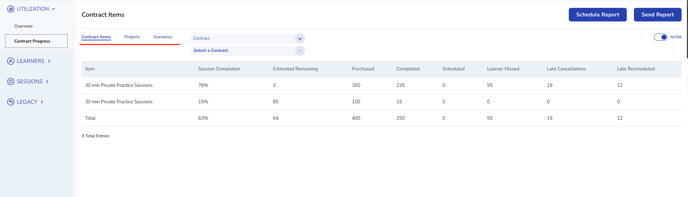
Contract Progress
This report allows you to see more details on the contract information you saw under the Overview tab. Similar to the overview tab, if you have multiple active contracts, be sure to select the contract you are interested in reviewing first. Then, at the top, you can select how you would like to see the data separated:
- Contract Items: Allows you to see the usage separated by the line item on the contract
- Projects: Allows you to see the usage separated by the projects you have within the portal
- Scenarios: Allows you to see the usage separated by Scenario
Learners
Team and Project Activity
This page allows you to see details on your learner's activity based on the teams and projects your learners are assigned to. Use the Team, Project, and Scenario filter at the top to filter the charts to reflect only learners that are actively assigned to the team or project, or learners that have scheduled the selected scenario. 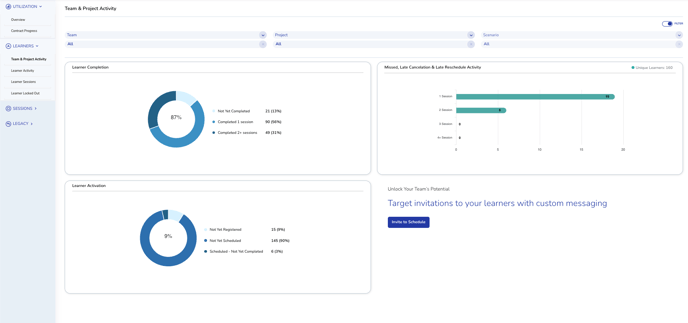
Learner Completion Chart
This chart reflects the number of learners that meet the filtered criteria and separates them based on if they have completed sessions and how many completions they have. This chart provides a good picture of how your learners are progressing through pathways within your organization.
Learner Activation
This chart reflects the learners that meet the filtered criteria and separates them based on how far through registration they've completed. Not Yet Registered indicates that the learner was invited but has not yet logged into the Mursion Portal. Not Yet Scheduled indicates that they have successfully registered but have not yet scheduled their first session. Scheduled - Not Yet Completed indicates that they have an upcoming session scheduled.
Missed, Late Cancelation & Late Reschedule Activity
This chart reflects the learners based on the number of Missed, Late Canceled, or Late Rescheduled sessions they have.
Learner Activity
This table will show you session data by learner. Each line item in this chart will reflect a single learner with details about the sessions that learner has scheduled, and the overall status of that session. This table also shows the Completed Scenarios, Assigned Teams, and Assigned Projects for each learner.
You can filter the learners that appear in this table by Team, Project, Scenario, or Registration Status using the filters at the top.
An additional filter option for session dates is available. Note - when using the session date filter, only learners with sessions in the selected dates will show. Learners who have not yet scheduled or only scheduled sessions outside of the selected dates will no longer appear in the list. 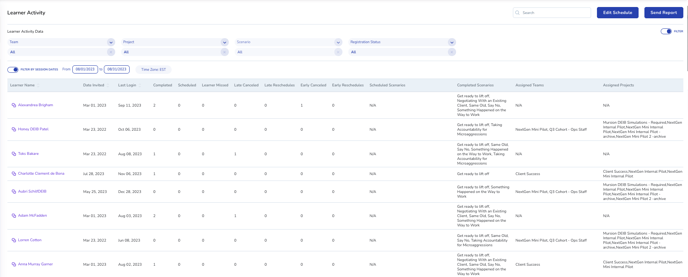
Learner Sessions
This table will show you all session data. Each line represents an individual session, including details like the learner, scenario, status, date and time of the session. If allowed, this report will also provide you a View Report button that you can click to access the session recording and session report.
You can filter the sessions that appear in this table by Team, Project, Scenario, Session Status, Learner Status, whether the simulation was recorded, and the date of the session using the filters at the top.
Clicking on a session will open the session card, allowing you to see additional details on the session. If the session has not yet occurred, you can also Cancel or Reschedule the session from this window.
Learner Locked Out
This table reflects learners that have been locked out of scheduling due to the number of sessions they have missed or late cancelled. For more information on this report and the learner lock out feature, click here.
Sessions
Session Summaries
The session summaries report is similar to the learner sessions report. Each line represents an individual session, including details like the learner, scenario, status, date and time of the session. This chart will not allow you to access the recording or report, but does include additional details like the time spent in the session or the number of times it was rescheduled by the learner.
Search for Session
This page allows you to search for a session using any applicable session information. Simply type the search criteria in the search bar in the upper-right hand corner and the system will show any sessions that meet that criteria. You can search by learner name, scenario name, or Session ID.
Any of the table reports can be emailed to someone as CSV file so that you can export the data as needed. Additionally, you can schedule these reports to be sent on a regular cadence. For more information on this, view our Exporting and Sending Reports article.