What is Voice Analytics
When voice analytics is turned on for a simulation, we'll process the audio through an algorithm to tell us general information about your simulation experience. It can be helpful to review and see how you performed after a simulation so you can prepare for your next simulation,
-
Was the learner attentive and listening?
-
How frequently does the learner interject
-
How often does the Sim interject?
Using the Voice Analytics Page
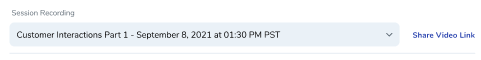
- In the Portal navigation bar, click Sessions

- In the Session Recording dropdown, select the simulation you'd like to review
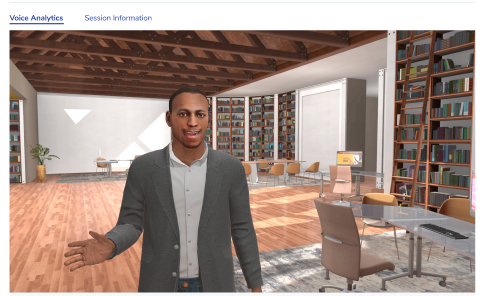
- The first section is the video of your simulation, on the top, you can toggle between the Voice Analytics and Session Information
|
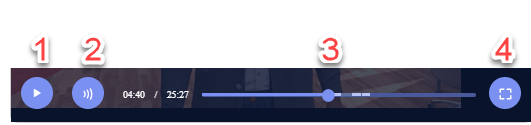
The media controls.
|
 |
The Flow Graph
Below the video player is the Flow Graph. The flow graph is where a learner can scan through the simulation to review moments where they were speaking, listening, or interjecting. 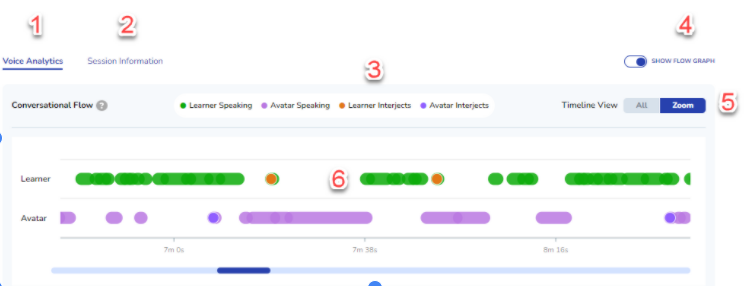
-
Selects the voice analytics view
-
Selects the Session Information view - Displays simulation strategies and delivery details
-
Legend - The colors of each moment correspond to a data point on the Flow Graph where the learner or avatar is speaking or interjecting
-
Toggles the Flow Graph off and on
-
The learner can select between All - to view the entire timeline - or click Zoom to get a closer look at data points.
-
The Flow Graph - highlights moments where the learner or avatar is speaking or interjecting
The Flow Graph allows the user to scrub through individual moments during the simulation to better understand how they performed at that moment.
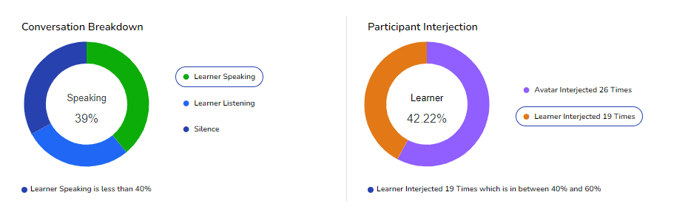
Summary Graphs
At the bottom of the screen are the Conversation Breakdown and the Participant Interjection graphs
-
Conversation Breakdown: This shows the balance between speaking, listening, and silence
-
Participant Interjection: This shows how well the participants were able to communicate without interruption